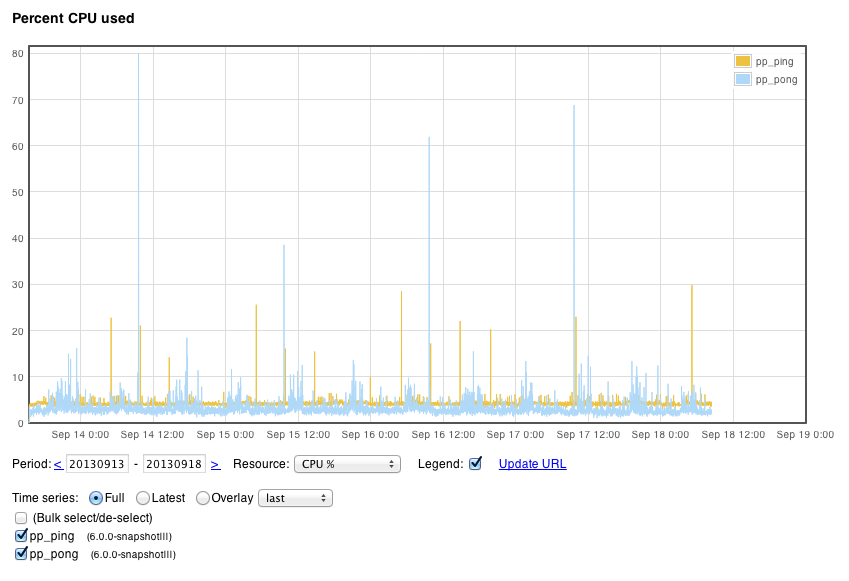
Iguana Monitor is an easy-to-deploy utility that monitors any number of Iguana instances and reports on their health with automatically-generated graphs. For every specified Iguana instance, Iguana Monitor records the results of a “monitor_query” request in a SQLite database. The information is then plotted automatically, producing an interactive graph like this:
The following metrics are included:
- Virtual Memory Usage
- Resident Memory Usage
- Open File Descriptors
- CPU Usage (%)
- Disk Usage (%)
The above information can be graphed for an arbitrary period of time (daily by default). In addition, multiple instances of Iguana can be represented on any given graph.
Step 1: Organize the source files
- Download the following three files:
- Create the following directory: <Iguana install directory>/plotter
- Unzip jquery.zip into this new folder, resulting the following: <Iguana install directory>/plotter/jquery
Step 2: Adjust Iguana Settings
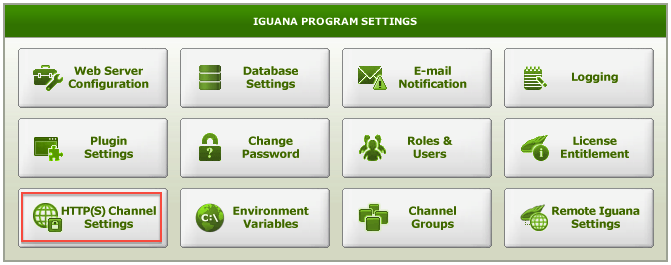
- Launch Iguana and from the Dashboard, click the Settings tab.
- Click the HTTP(S) Channel Settings button:
- In the window that appears, click the Edit button.
- Enable the Serve Files From a Directory setting, and in the Directory for Files field, browse to and select the new directory: <Iguana install directory>/plotter
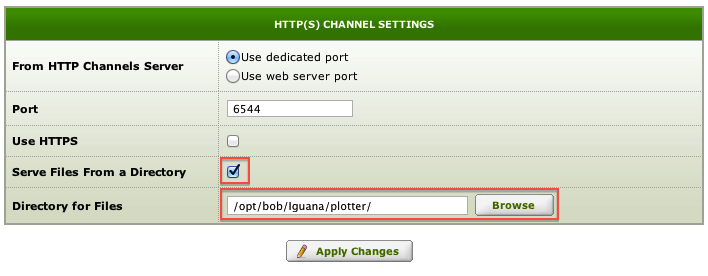
- Click the Apply Changes button.
Step 3: Create the ‘Monitor’ channel
This channel queries metrics from the specified Iguana instances and records that data in a SQLite database:
- Return to the Dashboard and click the Add Channel button.
- Select the following components:
- Source = From Translator
- Destination = To Channel
- Click the Configure Channel button. The Configure New Channel window appears.
- In the Channel tab, enter the following:
- Channel name = Monitor
- Description = Query metrics from specified Iguana instances and send results to SQLite database.
- In the Source tab, set the Poll time value to 18000000 (5 minutes). This value can be anything, but we recommend no lower than 1 minute.
- We are going to leave the other channel component settings as their defaults, so simply click the Add Channel button. The channel is created and several warnings appear. Don’t worry! This is just Iguana reminding us that before we can run the channel, we’ll need to commit at least one milestone. We’ll perform this step shortly.
- In the Source tab, click the Edit Script hyperlink to launch the Translator.
-
In the dialog that appears, select Import project from zip file and enable Import sample data.
- Click the Choose File button and browse to select the Monitor_From_Translator.zip project file that you’ve just downloaded.
- Click Import. Iguana loads the project into the Translator.
Step 4: Add credentials to the ‘Monitor’ channel
- From the Project Files panel, click the ‘instance_list’ module to open its contents:
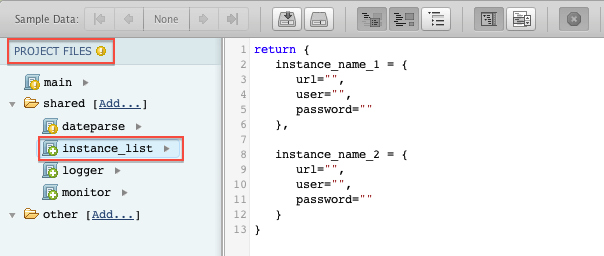
-
Modify this script with the correct credentials for the various Iguana instances that you wish to monitor. You can add additional Iguana instances by appending additional rows to the table:
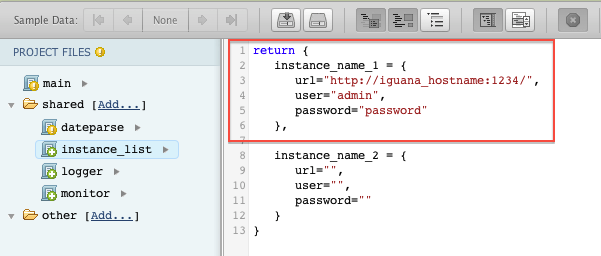
- Remove any empty, unused instances from the script.
- Return to the Dashboard and click the Start/Stop button to run the channel.
Step 5: Create the ‘Plotter ’ channel
In response to a web request, this channel queries the SQLite database (previously populated by the ‘Monitor’ channel), creates a time-series, then plot graphs of this data.
- Return to the Dashboard and click the Add Channel button.
- Select the following components:
- Source = From HTTP(S)
- Destination = To Channel
- Click the Configure Channel button. The Configure New Channel window appears.
- In the Channel tab, enter the following:
- Channel name = Plotter
- Description = This channel produces data and plots graphs based on the results of the Monitor channel.
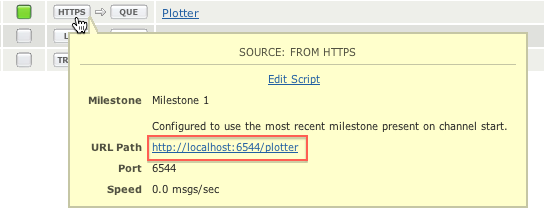
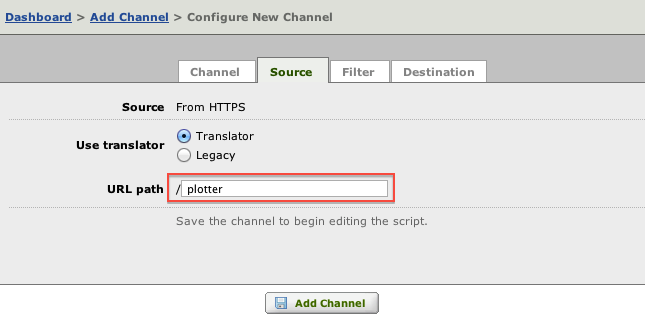
- In the Source tab, enter the URL path as “plotter”:
- We are going to leave the other channel component settings as their defaults, so simply click the Add Channel button. The channel is created and several warnings appear. Don’t worry! This is just Iguana reminding us that before we can run the channel, we’ll need to commit at least one milestone. We’ll perform this step shortly.
- In the Source tab, click the Edit Script hyperlink to launch the Translator.
- In the dialog that appears, select Import project from zip file and enable Import sample data.
- Click the Choose File button and browse to select the Plotter_From_HTTPS.zip project file that you’ve just downloaded.
- Click Import. Iguana loads the project into the Translator.
- Commit your first milestone.
- Return to the Dashboard and click the Start/Stop button to run the channel.
Done! To query the new Iguana Monitor interface and see your work in action:
- Return to the Dashboard.
- Hover your mouse over the Plotter channel’s source component.
- In the tooltip that appears, click the URL Path hyperlink provided: