Overview
When you first launch Iguana, the software’s main screen displays the Iguana Dashboard. The Dashboard is your mission control console, designed to give you a top-level view of your interface and direct access to all major Iguana functions.
From here, you can:
- Manage your channels
- Stop and start the flow of data
- Monitor your connections and servers
- Customize your Iguana settings
- Search the logs
The Dashboard includes several tabs, panels, and tools to help streamline your workflow:

- The top Dashboard panel shows all the channels in the selected servers.
- The bottom Dashboard panel shows the Server List that the dashboard is monitoring:
- We can view literally thousands of interfaces from a single dashboard
- The servers shown in the Server List are specified in Remote IGUANA Servers
- This example shows the channels from two of our three servers
- The Dashboard tab brings us back to the this screen.
- The Logs takes us to the Logs screen.
- Settings takes you to the Iguana Program Settings page where you manage Iguana Server configuration.
- Use the Search box to filter which channels are visible, based on their name and description:
- You can filter with boolean searches and regular expressions (regex)
- Some good uses of this are to put CRM IDs in descriptions of channels that map to customers, the search argument can then be supplied on the URL allowing integration with CRM products like Salesforce.com
- The View Options (the grey vertical bar on the left) slides out a selector which allows users to customize the columns in the top and bottom panels.
- Bang (!) symbols are used to indicate configuration errors and warnings.
- Channel Actions allows us to perform bulk actions on the channels that have been selected.
- The Add Channel button allows us to create a new channel.
- In Msgs/Sec shows the number of messages coming into the server each second, Out Msgs/Sec shows the number going out.
- Web API links to server information in Expanded (user friendly text) or Compact (XML) format, you can also use HTTP to call the web service API (Monitoring an Iguana Instance with Iguana).
Note: You can sort the Dashboard display in ascending/descending order for any column, by clicking once/twice on the column header name.
Tip: You may find it useful to add the Channel Info column (it is not displayed by default). Use View Options to display it, see Specifying which Dashboard Columns to View.
It gives access to two administration screens:
- Use the Channel Properties page to configure which channels start automatically and their runtime debug levels
- The Channel Routes page gives a diagram showing the configured routes
Dashboard Columns [top]
The Dashboard’s most useful feature is that it provides an interactive bird’s eye view of all your channels and servers.
Default Channel Columns
The top Dashboard panel provides a table of information designed to give you instant access to Channel Management tasks:

| Column | Description | Clicking on | Tooltips |
|---|---|---|---|
| Checkbox | Select multiple channels to do various bulk operations like clearing channel errors, stopping and starting etc | ||
| Start/Stop | Stop and start channels | Stops or starts channel | |
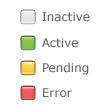
| Activity Light |  |
Shows summary of channel activity | |
| Type | Source and Destination components | Takes you to the configuration screen for the component | Shows configuration for each component and runtime statistics |
| Name | Name of the channel | Takes you the configuration page for the channel | Shows description and channel groups |
| Last Activity | Last recorded transaction for the channel or “–” if was no activity since the channel was last started | Jumps into the logs screen with that transaction | Shows summary of transactions processed |
| Errors | Number of errors on the channel | Jumps into the logs showing those errors | |
| Queued | Number of unprocessed transactions remaining for the channel | Jumps into the logs showing the queued messages and those already processed. This allows repositioning of the queue |
Default Server Columns
The bottom Dashboard panel provides a table of information designed to give you instant access to Server Management tasks:

| Column | Description | Clicking on | Tooltips |
|---|---|---|---|
| Checkbox | Select which servers to connect to | Connects to server and shows information in the panel | |
| Activity Light |  |
||
| Server Name | |||
| Time | Time on the Server | ||
| Running Channels | Number of running channels and the total number of channels | ||
| Service Errors | Number of errors on the server | Jumps into the logs showing those errors, the [clear] link marks all the errors as deleted | |
| Queued | Number of unprocessed transactions remaining for the server | ||
| In Msgs/Sec | Number of messages coming into the server per second | ||
| Out Msgs/Sec | Number of messages going out of the server per second | ||
| Web Api | Links to display server information | The Expanded link displays as user friendly text, Compact displays as XML |
Specify which Dashboard Columns to view [top]
You can specify the columns to be displayed in either the Dashboard channel list or the Dashboard server list.
To specify the options to be viewed, click View Options (the grey vertical bar located at the left of the screen). List boxes appear that display the columns currently being displayed in both lists:

Select the columns that you want to display, or unselect the columns that you do not want to display. To hide the View Options list boxes, click on the grey bar.
