Dashboard Columns
Contents
The Dashboard’s most useful feature is that it provides an interactive bird’s eye view of all your channels and servers.
Default Channel Columns [top]
The top Dashboard panel provides a table of information designed to give you instant access to Channel Management tasks:

| Column | Description | Clicking on | Tooltips |
|---|---|---|---|
| Checkbox | Select multiple channels to do various bulk operations like clearing channel errors, stopping and starting etc | ||
| Start/Stop | Stop and start channels | Stops or starts channel | |
| Activity Light |  |
Shows summary of channel activity | |
| Type | Source and Destination components | Takes you to the configuration screen for the component | Shows configuration for each component and runtime statistics |
| Name | Name of the channel | Takes you the configuration page for the channel | Shows description and channel groups |
| Last Activity | Last recorded transaction for the channel or “–” if was no activity since the channel was last started | Jumps into the logs screen with that transaction | Shows summary of transactions processed |
| Errors | Number of errors on the channel | Jumps into the logs showing those errors | |
| Queued | Number of unprocessed transactions remaining for the channel | Jumps into the logs showing the queued messages and those already processed. This allows repositioning of the queue |
Default Server Columns [top]
The bottom Dashboard panel provides a table of information designed to give you instant access to Server Management tasks:

| Column | Description | Clicking on | Tooltips |
|---|---|---|---|
| Checkbox | Select which servers to connect to | Connects to server and shows information in the panel | |
| Activity Light | |
||
| Server Name | |||
| Time | Time on the Server | ||
| Running Channels | Number of running channels and the total number of channels | ||
| Service Errors | Number of errors on the server | Jumps into the logs showing those errors, the [clear] link marks all the errors as deleted | |
| Queued | Number of unprocessed transactions remaining for the server | ||
| In Msgs/Sec | Number of messages coming into the server per second | ||
| Out Msgs/Sec | Number of messages going out of the server per second | ||
| Web Api | Links to display server information | The Expanded link displays as user friendly text, Compact displays as XML |
Specify which Dashboard Columns to view [top]
You can specify the columns to be displayed in either the Dashboard channel list or the Dashboard server list.
To specify the options to be viewed, click View Options (located at the left of the screen). List boxes appear that display the columns currently being displayed in both lists:
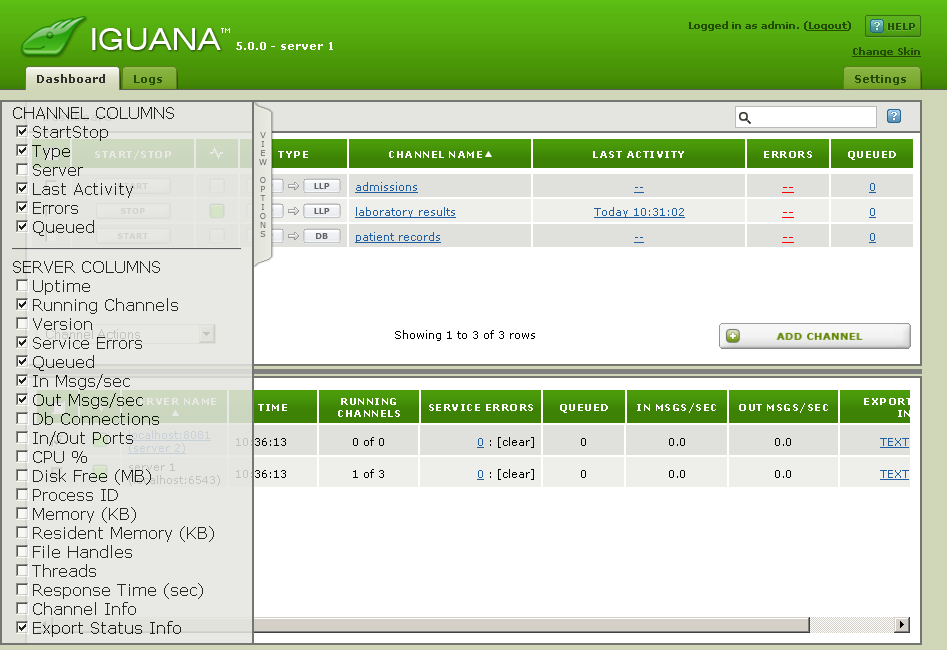
Select the columns that you want to display, or unselect the columns that you do not want to display. To hide the View Options list boxes, click anywhere in the Dashboard outside the list boxes.