Annotations and tracepoints
Contents
Hello, fellow Translators!
I recently exchanged a few emails with a customer regarding “tracepoints” in the Translator’s annotations. Specifically, the customer wanted know: “How do I structure my code to produce less brittle tracepoints?” Below are the tips and tricks that I shared with him. Hopefully, other users interested in the inner workings of the Translator can benefit from our discussion!
Before You Start
Annotations, in case you aren’t already aware, are those gray blocks that appear to the right of a function, showing its inputs/outputs and the inputs/outputs of other functions that it calls. These are updated automatically every time your script changes (or when new sample data is selected).
Tracepoints are specific parameters or return values to a specific function. When you click on a tracepoint in an annotation, it gets displayed in a dialog (which you can dock at the bottom of the page). As annotations are updated, these tracepoints are updated too.

How it Works
How Are Tracepoints Updated?
What determines the “sameness” of a tracepoint as the script execution path (or the script itself) changes? It is important to understand how tracepoints are updated if you want to understand why my tips work.
Consider the following (simplified) example below, where we decide to examine the “2nd call to trace() from the MapPatientData() function” (outlined in red in the screenshot below):
Note: The call to trace() in the main() function is not counted when we say the “2nd call to trace()“, as it is in a different function (main() in this case).

Under the hood, the item we’re tracing (the parameter to the 2nd call to trace() in MapPatientData()), is actually addressed just like how it sounds:
1st call to main() > 1st call to MapPatientData() > 2nd call to trace() > 1st trace() parameter
Here is the code:
local conn = db.connect{
   api=db.MY_SQL,
   name='test',
   user='root',
   password='password'
}

function main()
   local PatientRows = conn:query{sql='SELECT * FROM Patient'}
   trace('Found '..#PatientRows..' patients')
   for i=1,#PatientRows do
      local NewMessage = hl7.message{name='ADT',vmd='demo.vmd'}
      MapPatientData(NewMessage.PID, PatientRows[i])
   end
end

function MapPatientData(PID, PatientRow)
   -- trace('New trace')
   trace(PatientRow.Id)
   trace(PatientRow.LastName) -- Click the argument to trace() in annotations.
end
Problems?
This method of addressing tracepoints is a heuristic. As such, a solution that will produce consistent and intuitive “sameness” for tracepoints as code changes is not possible. If you’re a developer, and you’ve looked at “diffs” for code files, you’ve probably already seen this. No diffing algorithm can, in every single situation, show the code modifications as you, the developer, see them. It may show a line of code as being modified, when in fact you have added what you consider to be a brand new line of code (or vice versa). Conclusion? A heuristic is necessary.
In practice, although a heuristic works well, it’s not without problems. Look at the example code snippet above. If you add another call to trace() at the top of MapPatientData(), trace(PatientRow.Id) becomes the new tracepoint (since it is now the 2nd call):

That’s unfortunate, because a human would realize that you probably want to be looking at the 3rd tracepoint, after making this modification to your code.
Here’s a slightly more complicated example:
function foo(A, B)
   if A then
      trace(A)
   end
   trace(B) -- 'B' is my tracepoint
end
If ‘A’ is ‘true’, my tracepoint is the 2nd call to trace(). If ‘A’ is ‘false’, however, my tracepoint becomes the 1st call to trace(). Consider this use case:
- Code is written to call
foo(true, 'bar') - Tracepoint for
trace(B)is clicked (the “2nd call totrace()):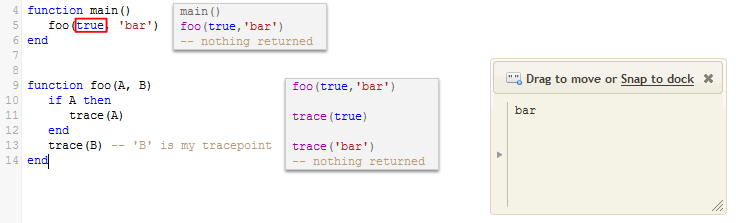
- Code is changed to call
foo(false, 'bar') - Now the Translator reports that the tracepoint was not reached. This is because, technically, there is no “2nd call to
trace()“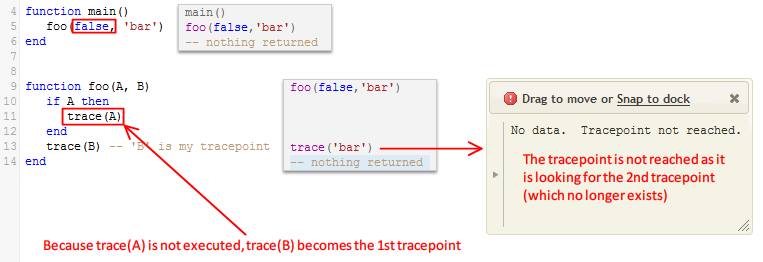
Solutions!
1. Use Short Functions
Now that we understand the problems one can encounter with tracepoints, let’s examine some solutions!
The most important thing you can do to get less brittle tracepoints is keep your functions short. Eliot outlines the importance of in his article, “Keep your functions short“. I would like to add even more good reasons to adhere to this practise:
- Fewer calls to the same function (
trace(), for example) within one function mean that adding/removing calls will not affect other tracepoints - With well-defined functions, there will be almost no need to call functions like
trace(), since the inputs and outputs of each function will themselves be available as tracepoints
This is perhaps best illustrated with an example. Consider this script:
local conn = db.connect{
   api=db.MY_SQL,
   name='test',
   user='root',
   password='password'
}

function main(Data)
   local M = hl7.parse{data=Data, vmd='MySchema.vmd'}
   local T = db.tables{vmd='MyTables.vmd', message='Register'}

   trace(M.MSH)
   T.Message[1].From = M.MSH[4]
   -- ...
   trace(T.Message[1])

   trace(M.PID)
   T.Patient[1].Id = M.PID[2]
   -- ...
   trace(T.Patient[1])

   if not M.NK1:isNull() then
      trace(M.NK1)
      T.Kin[1].LastName = M.NK1[2][1][1]
      -- ...
      trace(T.Kin[1])
   end

   conn.merge{data=T, ...}
   trace(T)
end
This script will result in very brittle tracepoints (plus it’s bad style, these are related!). With smaller functions, not only can I reduce the number of trace() calls per function, I actually reduce the need for them at all:
local conn = db.connect{
   api=db.MY_SQL,
   name='test',
   user='root',
   password='password'
}

function main(Data)
   local M = hl7.parse{data=Data, vmd='MySchema.vmd'}
   local T = db.tables{vmd='MyTables.vmd', message='Register'}

   MapMsh(M.MSH, T.Message[1])
   MapPid(M.PID, T.Patient[1])

   if not M.NK1:isNull() then
      MapNk1(M.NK1, T.Kin[1])
   end

   conn:merge{data=T, ...}
   return T
end

function MapMsh(MSH, T) -- inputs will be shown in annotations, both here and where the function is called.
   T.From = MSH[4]
   -- ...
   return T -- output will be shown in annotations, both here and where the function is called.
end

function MapPid(PID, T) -- inputs will be shown in annotations, both here and where the function is called.
   T.Id = PID[2]
   -- ...
   return T -- output will be shown in annotations, both here and where the function is called.
end

function MapNk1(NK1, T) -- inputs will be shown in annotations, both here and where the function is called.
   T.LastName = NK1[2][1][1]
   -- ...
   return T -- output will be shown in annotations, both here and where the function is called.
end
Because all functions’ inputs and outputs are already available as tracepoints, I don’t need trace() calls at all. Furthermore, the tracepoints that are there are not brittle because they are associated with something meaningful. For example, the call to MapMsh is used rather than some Nth call to a meaningless function, trace().
2. Use Return Statements
In the above example, I was using Lua return statements instead of trace(). Why? Because a function can have many calls to trace(), but only one ‘return’ (at least, only one ‘return’ that is executed). So going back to this example:
function foo(A, B)
   if A then
      trace(A)
   end
   trace(B) -- 'B' is my tracepoint
end
A very simple way to make the ‘B’ tracepoint more reliable is to use ‘return’ instead:
function foo(A, B)
   if A then
      trace(A)
   end
   return B -- 'B' is my tracepoint
end
3. Other Solutions?
It’s hard to outline a set of “general rules” because each trick is context-dependent. Something might work on one function, but not another. For example, let’s go back to this function again:
function foo(A, B)
   if A then
      trace(A)
   end
   trace(B) -- 'B' is my tracepoint
end
A trivial way to restructure this particular function, without changing its overall logic, would be as follows:
function foo(A, B)
   trace(B) -- 'B' is my tracepoint, and it comes first
   if A then
      trace(A)
   end
end
Now the 1st trace()call will always be 1st, and the 2nd call will either be 2nd or not reached (which makes sense).
I could sit here and write other examples for days, but in general, the best solution is to break things up into smaller functions. These tracepoints will then work themselves out.
What’s Next?
My general advice? Don’t worry about this stuff! This article is strictly for users who wish to gain more technical knowledge on how annotations’ tracepoints work, under the hood. In general, if you have clean, nicely structured code, you will encounter very few (or no) problems with your tracepoints “breaking”. If they do break, the solution is simple: close the dialog/tab, and then reopen it.
Please contact support at support@interfaceware.com if you need more help.
Happy tracing!
– Kevin Senn
iNTERFACEWARE