- Introduction
- Calculate Highest Load
- Create a Channel to measure the load
- Using the HL7 Simulator to Simulate the Demand
- Monitoring the Disk, CPU and Network Usage
- Windows: Adding Logs and Counters in Perfmon
- Windows: Starting Counters
- Windows: View Results
- Windows: View CPU
- Windows: View Disk
- Windows: View Network
- Linux: View CPU
- Linux: View Disk
- Linux: View Network
- Mac OS X: View CPU
- Mac OS X: View Disk
- Mac OS X: View Network
Introduction
This article demonstrates how to assess your hardware system requirements manually via the use of system monitoring tools. Using the expected and the peak volume of messages, you can simulate the demand of messages using the HL7 Simulator. Then, using the system monitoring tools you can monitor the load effects on your system with regards to:
- Disk usage
- CPU usage
- Network usage
Note: This tutorial explains how to determine the system requirements using a sample scenario. To determine your own system requirements, you should use your actual data and custom channel settings.
Calculate Highest Load [top]
To calculate the highest load of messages that you’ll be expecting, you must first gather the following information:
- What the expected volume of messages is
- What the peak volume of messages is
Once you obtain this information, you can easily simulate the expected demand using the HL7 Simulator. This will help you determine what the load effects will be like on the system Iguana is running on.
For example, let’s say a clinic receives 60,000 messages per day, and 80 percent of those are during the 9-10 am and 4-5 am time periods for in and out patients, as shown in the following diagram:
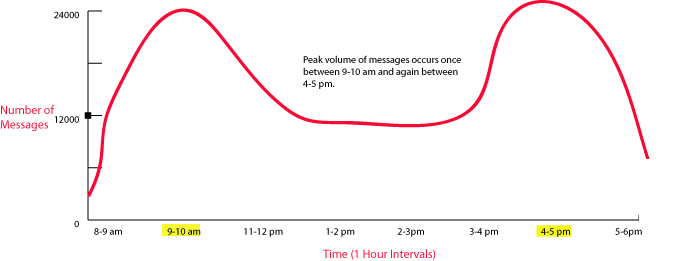
To calculate the 80 percent load of messages sent per second for those peak hours, you would do the following:
80% x 60,000 messages / 2 hours / 60 minutes / 60 seconds = ~6.67 messages per second
By adjusting the Time delay (ms) option in the HL7 Simulator, you can then simulate the demand at a rate of ~6.67 messages per second. First, you’ll need to set up your test channel in Iguana.
Create a Channel to measure the load [top]
The next step is to set up a test channel in Iguana to simulate the demand of messages you will be receiving during those peak hours.
Ensure that the Iguana service is started, and you are logged into the web interface as described in Logging into the User Interface.
Note: Since this is just a test, specific channel configuration options will not be discussed in this section. For more information about configuring channels, see Iguana Channel Settings. In a real-world situation, you should be using your custom channel settings to perform the tests.
The following sections describe how to create a test channel using Iguana.
Add the test Channel
- Open Iguana.
- In the Dashboard Control Panel, click Add Channel. The Add Channel screen appears.
- Select LLP Listener as the Source and To Database as the Destination, since you will be receiving HL7 messages over TCP/IP and putting them into a database.
- Click Start configuring.

Fill out the test Channel Details
- In the Channel name field, specify a name to identify the channel on the Dashboard and in the logs:

For this tutorial, you can leave the rest of these fields unchanged. See Configuring the Channel Settings for more information.
Configure the LLP Listener Component
- Click the Source tab.
- In the Port field, specify the port you want to listen on for LLP-encoded HL7 messages:
Note: This can be any unused port.

For this tutorial, you can leave the other fields unchanged. For more information on the fields in this screen, see settings for the LLP Listener component.
Configure the To Database Component
- Click the Destination tab.
- From the Database API list box, select the database API you will be using (for example, MySQL).
- In the Data source field, specify either the ODBC Data Source name (if you are using an ODBC Database API), or the actual name of your database (if you are using a non-ODBC API).
- In the Database username and Database password password fields, type the username and password required to access the database. This would have been set by the database administrator. In some cases, these two fields may be left blank.
- In the Full parser VMD path field, type the path of the VMD file you want to parse the messages with. For test purposes, you can download and use this advanced03.vmd.
- Leave all the other fields as is. (For more information on these fields, see settings for the To Database component.)
Export Database Tables for the channel
- Click the Tables tab.
Note: This tab appears when you create a channel that has a database as the source or destination component. - Click Export Destination Tables:

- An Export Tables preview screen appears, listing the SQL statements that will be used to create the tables:

- In this screen, click Confirm Table Export. The tables are exported to the specified database API.
The channel has now been created.
Using the HL7 Simulator to Simulate the Demand [top]
In order to simulate the demand, you must first calculate the rate at which the HL7 Simulator will send messages per second to Iguana. Then, using this value you need to modify the Time delay option accordingly.
To calculate the rate at which the Simulator will send messages to Iguana, do the following:
1 second / 6.67 messages (highest load during peak hours) = 0.1499 (~150 ms)
Note: The 150 ms value is only an approximate value at best, since the above calculation does not take into account the amount of time it takes for the message to:
- Travel to Iguana
- Get parsed
- Get inserted into a database
Moreover, it does not take into account the time it takes for Iguana to generate and send the ACK message to the sending application (in this case, the HL7 Simulator). As a result, there will be less than the estimated 6.67 messages per second on average.
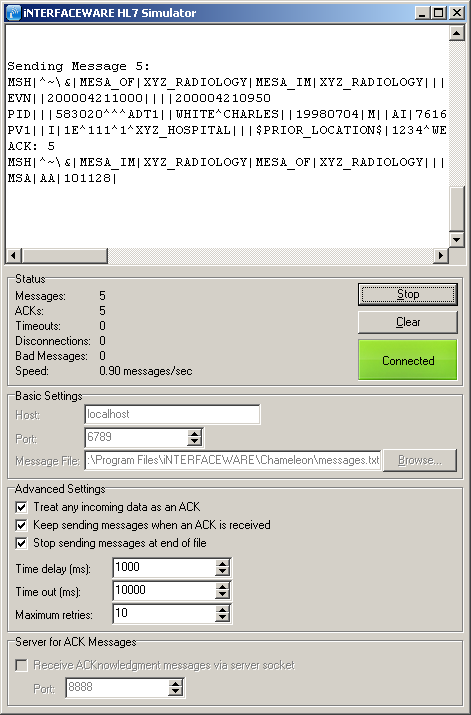
To use the HL7 Simulator:
- Open the HL7 Simulator application. (To access it, click Start, then Programs, iNTERFACEWARE, HL7 Analytical Tools and HL7 Simulator.)
- Fill in the following details:
- Host – Enter localhost if you’re sending messages to your own machine, or type the IP address or host name of the machine you’re sending messages to.
- Port – Enter the port number that the Simulator is sending to. Note that this must be the same port number used to set up the Source LLP Listener in the channel you created.
- Message File – Specify the HL7 messages input file that the Simulator will send. For testing purposes you could use the message file in the Chameleon install directory.
- Keep sending messages when ACK Received? – Ensure this option is checked so that the next HL7 message is sent to the server as each ACK is received.
- Time delay (ms) – Using the above calculation, set this value to 150 ms. Remember, this is the rate at which the Simulator will send messages per second (in this case, 6.67 messages per second).
- Leave everything else as is, and start both the Iguana channel you created and the HL7 Simulator. You can start the Simulator by clicking the Start button. The Simulator starts sending messages to the channel you created.
- After confirming the channel is receiving data, the next step depends on the operating system you are conducting the test with:
- Windows – Stop the channel. The next step is to set up the applicable counters in Windows to measure system performance. See Windows Performance below.
- Linux – Leave the channel running after confirming the channel is receiving data. See Linux Performance below for the next steps.
- Mac OS X – Leave the channel running after confirming the channel is receiving data. See Mac OS X Performance below for the next steps.
Monitoring the Disk, CPU and Network Usage [top]
Monitoring your system’s performance manually allows you to accurately determine your minimum system requirements in order to use Iguana effectively. This section shows you how to monitor your machine’s disk, CPU and network usage when running Iguana in Windows, Linux and Mac OS X operating systems. For each operating system, system performance was measured after one hour of activity.
The remaining pages in this tutorial provide detailed explanations of monitoring performance in Windows, Linux and Mac OS X.
Windows performance
It is possible to monitor your machine’s overall CPU, disk and network usage using applications included on Windows operating systems.
Tools: Perfmon, Windows Task Manager.
Monitoring Windows
- Windows: Adding Logs and Counters in Perfmon
- Windows: Starting the Counters (perfmon)
- Windows: Viewing the Results Data (perfmon)
- Windows: Viewing the CPU Usage (task manager)
- Windows: Viewing the Disk Usage (perfmon)
- Windows: Viewing the Network Usage (perfmon)
Linux performance
It is possible to monitor your Linux machine’s overall CPU, disk and network usage using tools available on most Linux systems.
Tools: top, vmstat (CPU usage), sar, iostat (disk usage), netstat (network usage).
Monitoring Linux
- Linux: Viewing the CPU Usage (top)
- Linux: Viewing the Disk Usage (iostat)
- Linux: Viewing the Network Usage (netstat)
Note: The applications listed above may not be available for all Linux implementations. In such cases, try to search for a suitable alternative using your favourite search engine.
Mac OS X performance
You can monitor your Mac system’s overall CPU, disk and network usage using the built-in Activity Monitor application. You can access the Activity Monitor from Applications/Utilities.
Tools: Activity Monitor.
Monitoring Mac OS X
Windows: Adding Logs and Counters in Perfmon [top]
This section shows you how to add logs and counters in perfmon in order to measure system performance. You can use these counters to measure and record system activity for a specified duration.
Note: The screenshots in this section were taken using Windows 2000. The screenshots and steps will vary slightly when using other Windows operating systems.
To start perfmon and add a new counter:
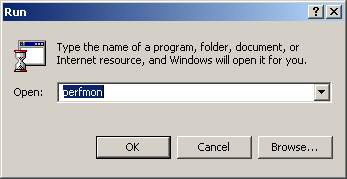
- Click Start > Run. The Run dialog window opens.
- Type perfmon, and click OK.
- In the left pane, expand the Performance Logs and Alerts node.
- Right-click Counter Logs and select New Log Settings.
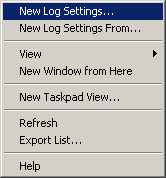
- Enter the name of the new log (e.g. Iguana_Processor), and click OK.
- In the dialog window that appears, click Add.
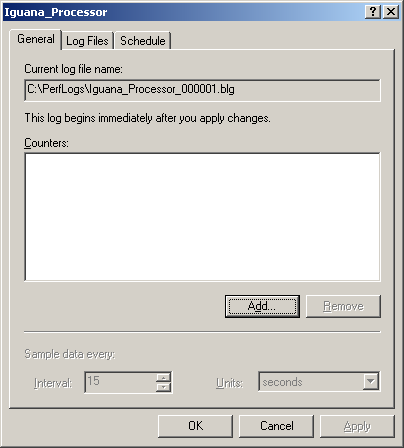
The Select Counters window appears.
- Under Performance object, choose the system component that you want to measure performance for.
- Then, ensure the Select counters from list option is selected, and choose the counters that you want to measure.
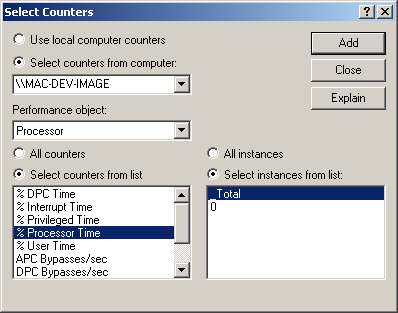
- After choosing the counters that you want to measure, click the Add button and click Close to exit.
- In the dialog window that appears, click OK. Another dialog window appears, asking you if you want to create a new folder called C:\PerfLogs.
- Click Yes to create the folder.
At this point you can either start the counter manually, or specify a scheduled time for it to run.
Windows: Starting Counters [top]
Manually Starting the Counters
- In the left pane under Performance Logs and Alerts, select Counter Logs.
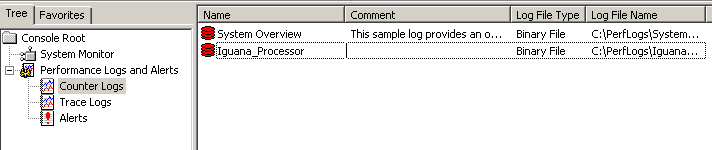
- In the right pane, right-click the log you want to start and choose Start. In some versions of perfmon the counter log is automatically started after creating it. You can stop it and restart it, or schedule a time for it to run.
Specifying a Scheduled Time for the Counters to Start
- In the right pane, double-click the log you want to start. The Log Properties window appears.
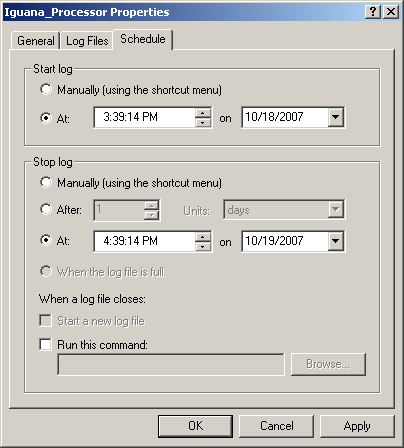
- Click the Schedule tab, and modify the Start and Stop settings accordingly.
- Click Apply > OK to confirm the changes and close the window.
Windows: View Results [top]
To view the results data:
- Open perfmon.

- In the left pane, choose System Monitor.
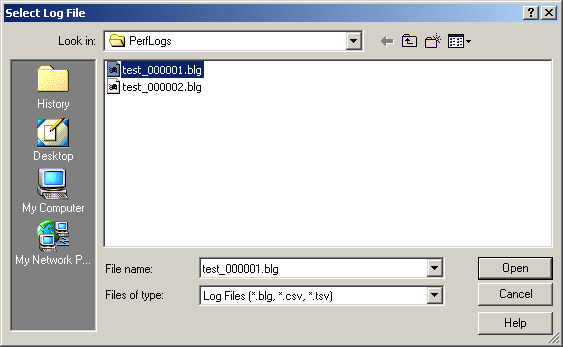
- In the toolbar, click the View Log Data icon.

- In the Select Log File window, select the log you want to view data for and click Open. The Log file is loaded.
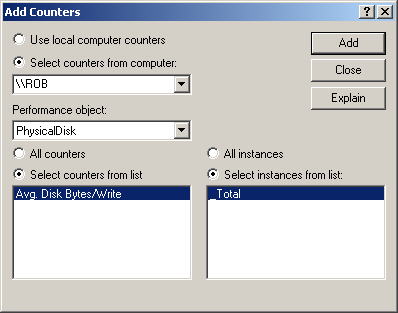
- In the toolbar, click the Add icon.

The Add Counters window appears.
- Under Performance object and Select counters from list, select the applicable system component and counter, and click Add > Close.
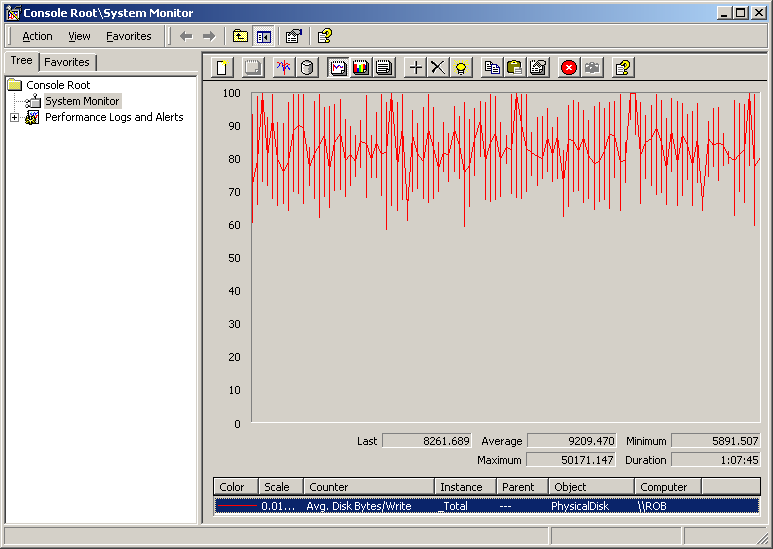
The Log Data is loaded and displayed.
Note: You will need to repeat these steps for every counter you want to view.
Windows: View CPU [top]
Using the Windows Task Manager
Windows Task Manager is a useful tool for collecting information on your system in real time. Unlike Perfmon, it does not provide a means for recording information.
To use Windows Task Manager:
- In Windows NT, Windows 2000, Windows XP and Windows Vista, press Ctrl+Alt+Del simultaneously to open the Windows Security Dialog, and then click Task Manager. In Windows XP, pressing Ctrl+Alt+Del simultaneously may also launch the application immediately.
- Click the Performance tab to display the CPU Usage.
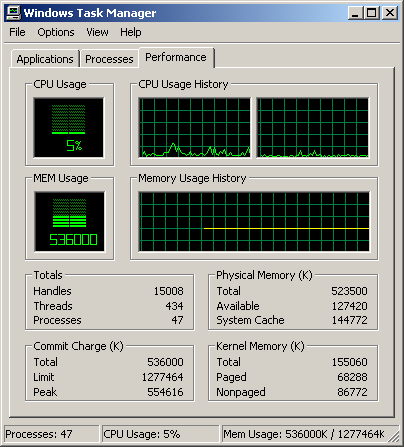
After one hour of running Iguana, the average CPU usage is as follows:
| CPU Counter | Description | Average Value | Suggested Average Threshold |
|---|---|---|---|
| CPU Usage | Percentage of time the processor is running an operation, other than when it’s idle. | 5% | 10-15%; threshold can increase if Iguana is the only main application running on the machine (not including background processes). For the most part this number should be below 20%, with only the occasional spike. |
Using Perfmon
After an hour of running Iguana, the average percentage of time the CPU took to process a thread is as follows:
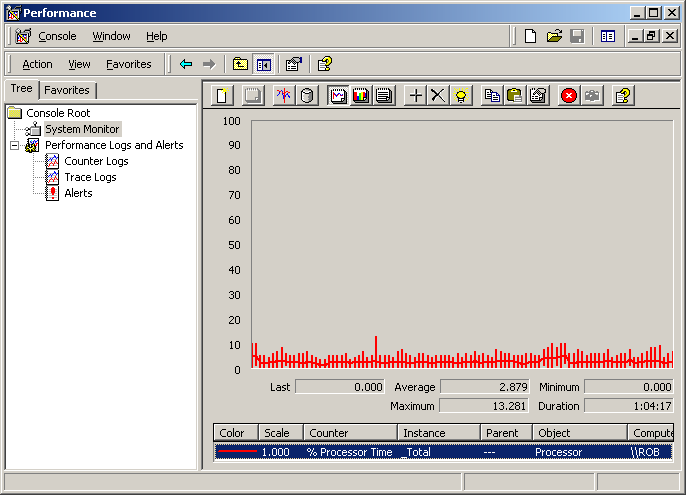
| CPU Counter | Description | Average Value | Suggested Average Threshold |
|---|---|---|---|
| % Processor Time | Percentage of elapsed time that the processor spends to execute a non-idle thread. | 2.879% | 85% |
Windows: View Disk [top]
After an hour of running Iguana, the disk usage stats are as follows:
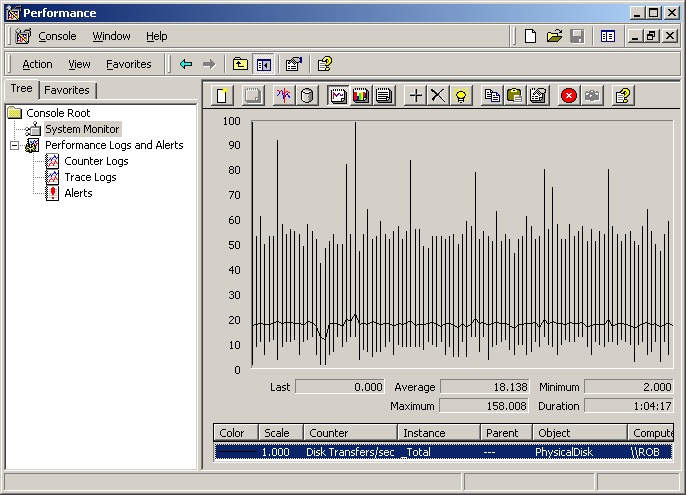
| Disk Usage Counter | Description | Average Value | Suggested Average Threshold |
|---|---|---|---|
| Disk Transfers/sec | Rate of read and write operations on the disk. | 18.138 disk transfers/sec | The accepted value depends largely on the manufacturer’s specifications. |
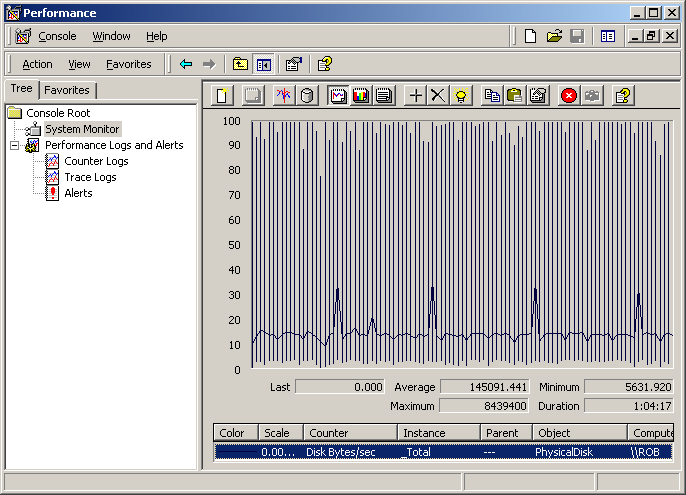
| Disk Usage Counter | Description | Average Value | Suggested Average Threshold |
|---|---|---|---|
| Disk Write Bytes/sec | Rate at which bytes are transferred to the disk during write operations. | ~145 KB/sec = 12.528 GB/24-hour period | The accepted value depends largely on the manufacturer’s specifications. |
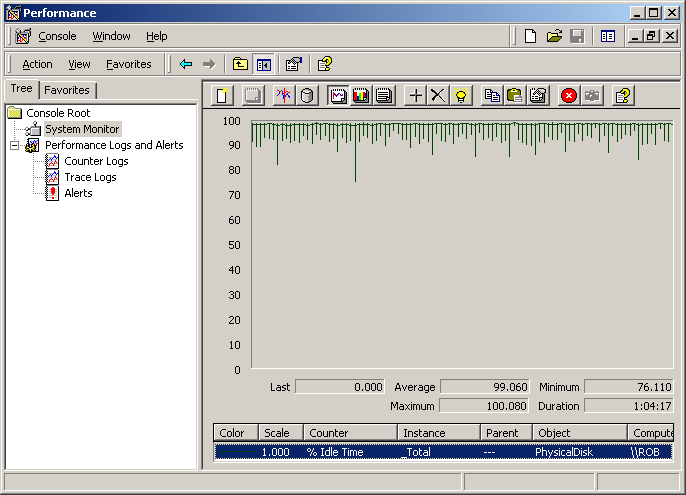
| Disk Usage Counter | Description | Average Value | Suggested Average Threshold |
|---|---|---|---|
| Disk Idle Time (%) | Percentage of time that the disk was idle during the specified interval. | ~99% disk idle time | 90% and above |
| Disk Usage Counter | Description | Average Value | Percent Value | Suggested Average Threshold |
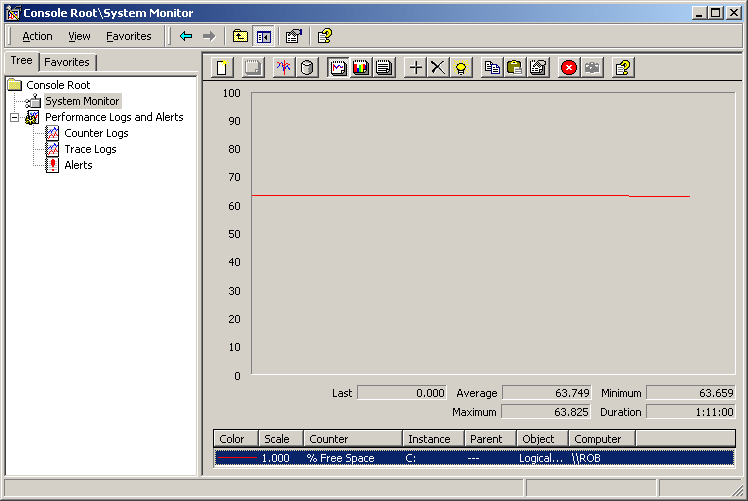
|---|---|---|---|---|
| Free Space (%) | Ratio of free space available on the logical disk unit to the total usable space provided by the selected logical disk drive. | ~34 MB/hour | 0.166% | Depends on the volume of messages you are expecting. |
To calculate your disk usage using the results found above, you would do the following:
63.825 (Maximum Value) - 63.659 (Minimum Value) = 0.166%/100% x 21,476,171,776 Bytes (Capacity of Hard Drive) = 35650445.14816 (Total Bytes)
To get the value in KB and MB, you would do the following:
35650445.14816 / 1024 / 1024 = ~34 MB
This means that Iguana writes approximately 34 MB to the disk every hour (assuming the message size is ~1 KB). This number will obviously fluctuate, depending on the size of your messages.
Windows: View Network [top]
After an hour of running Iguana, the rate at which bytes are received and sent over each network adapter are as follows:
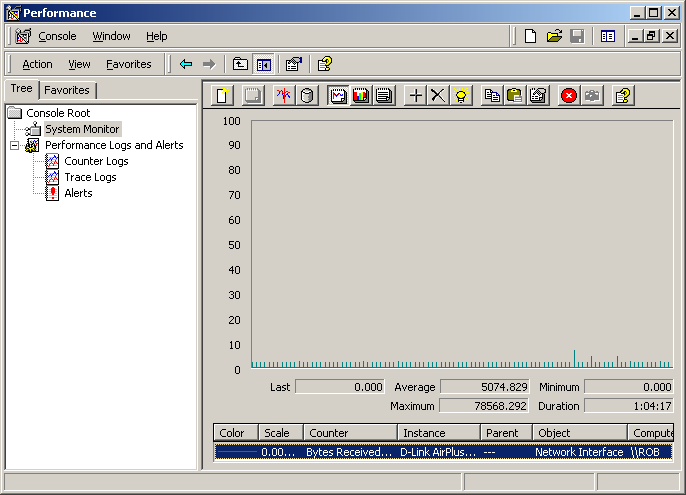
| Network Usage Counter | Description | Average Value | Suggested Average Threshold |
|---|---|---|---|
| Average bytes received per second. | Rate at which bytes are received on the network. | ~5 KB/sec | Depends on your network. Determine the number of applications you have on the network, and calculate the maximum load that your network can handle. |
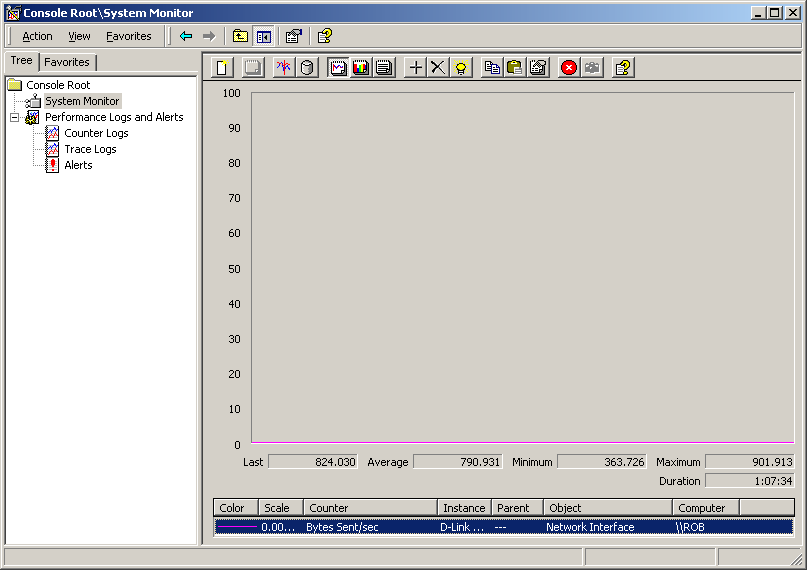
| Network Usage Counter | Description | Average Value | Suggested Average Threshold |
|---|---|---|---|
| Average bytes sent per second | Rate at which bytes are sent on the network. | Less than 1 KB/sec. | Depends on your network. Determine the number of applications you have on the network, and calculate the maximum load that your network can handle. |
Linux: View CPU [top]
To view the CPU usage in Linux, simply type top from a command prompt. Top provides you with an overall view of CPU usage in real time.
After an hour of running Iguana, the CPU usage stats are as follows:
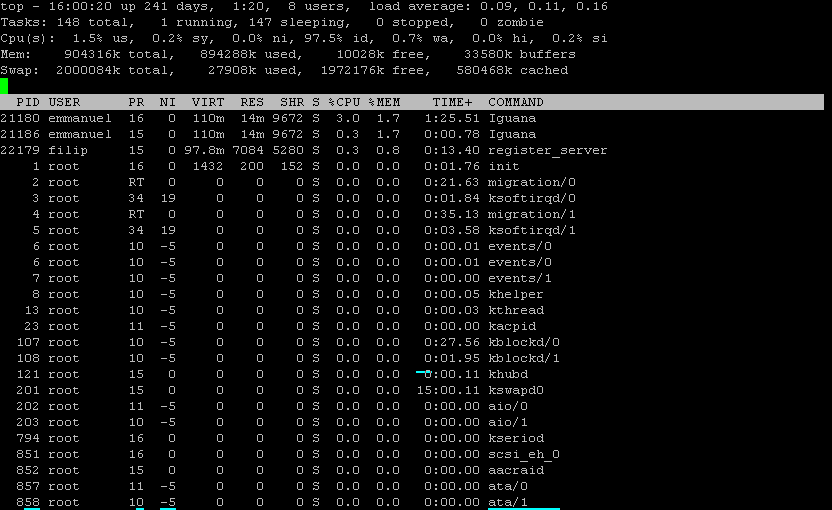
Note: This is an old screenshot the Iguana executable file is now named iguana, not Iguana.
| Top Parameter | Description | Value | Suggested Average Threshold |
|---|---|---|---|
| %CPU | The task’s share of elapsed time since the screen was last updated. This value is expressed as a percentage of total CPU time. | ~2.9% | 10-15%; threshold can increase if Iguana is the only main application running on the machine (not including background processes). For the most part this number should be below 20%, with only the occasional spike. |
To find out which process is using up the most CPU power, type the following command:ps -eo pcpu,pid,user,args | sort -r -k1 | lessThis displays the top 10 users on the Linux system. As you can see, Iguana is the top CPU user at 2.9%: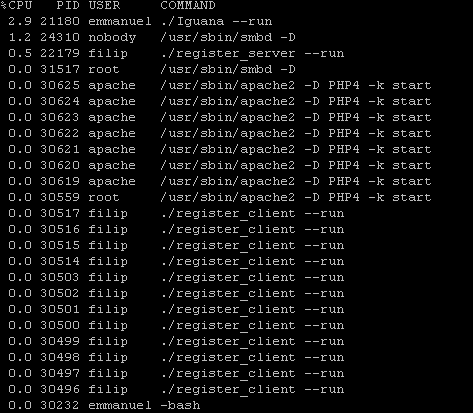 |
To view CPU stats, along with memory, i/o and swap information, simply type vmstat from a command prompt:

| Vmstat Parameter | Description | Value | Suggested Average Threshold |
|---|---|---|---|
| r (runnable threads) | Average number of runnable threads over a specified interval. | 1 | If r (runnable threads) / Number of CPUs = > 1 , there may be a CPU bottleneck. |
| us (user time) | Breakdown of percentage usage of CPU time. If a system has more than one processor, this value is the calculated average. | 3 | If us (user time) + sy (system call) = close to 100, there may be a CPU bottleneck. |
| sy (system call) | Interrupt rate per second. | 0 | If sy (system call) + us (user time) = close to 100, there may be a CPU bottleneck. |
Linux: View Disk [top]
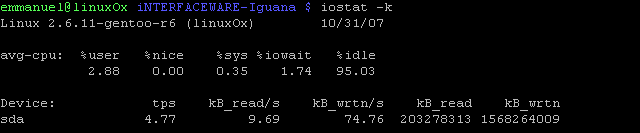
To view the disk usage in Linux, simply type iostat -k from a command prompt. Iostat allows you to monitor disk activities and adding the -k flag displays the output in KB.
After an hour of running Iguana, the disk usage stats are as follows:
| Iostat Parameter | Description | Value | Suggested Average Threshold |
|---|---|---|---|
| %idle | Displays the percentage of time that the CPU or CPUs were idle and the system did not have an outstanding disk I/O request. | 95.02% | > 20% – if this value is below 20%, the system might be queuing up disk I/Os and response time may suffer. |
To calculate overall disk usage after running Iguana for an hour:
KB_wrtn/s x 60 seconds x 60 minutes = Total KB/hour
Note: If you are running other applications on the same machine, the KB_wrtn/s stat will be inaccurate since iostat calculates the sum in KB of all the applications writing to the disk.
Linux: View Network [top]
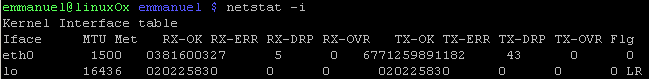
To view the network usage in Linux, simply type netstat from a command prompt. Netstat allows you to query network traffic on Linux:
After an hour of running Iguana, the network usage stats are as follows:
| Network Usage Command | Description | Suggestions |
|---|---|---|
| netstat | Displays general network statistics. | This command displays network connections (inbound and outbound), routing tables and network interface statistics. |
| netstat -i | Displays the state of network interfaces used for network traffic. | Large numbers should appear in the RX-OK and TX-OK columns. Low numbers should appear in the other columns. If there are many RX-ERRs or TX-ERRs, you may want to check the status of your NIC cable.The best way to check your overall network load is to run netstat continuously and capture the output. To run and record output, you would do the following:<b>netstat --inet -a -c > netstat.txt</b>Then you can review the output after running Iguana for a specified time (e.g. one hour) to measure the network load performance during peak hours. |
| netstat -an |grep :8081 | Displays all active connections on default Iguana port 8081. | This command is a good way to check which machines are connected to yours. |
Mac OS X: View CPU [top]
To view the CPU usage:
- Click Finder > Applications > Utilities > Activity Monitor. The Activity Monitor allows you to view the system CPU usage in real time.
- Click the CPU tab to view the CPU stats.
Note: Any process can be selected for deeper inspection. To inspect a process, double-click it from the Activity Monitor. In the window you’ll find information about an application’s memory usage, various statistics, and a list of files that the process is making use of.

| CPU Parameter | Description | Value | Suggested Average Threshold |
|---|---|---|---|
| % CPU | Shows the CPU percentage that each process is using. | 1.50% | 10-15%; threshold can increase if Iguana is the only main application running on the machine (not including background processes). For the most part this number should be below 20%, with only the occasional spike. |
Mac OS X: View Disk [top]
To view the disk activity on a Mac:
- Click Finder > Applications > Utilities > Activity Monitor. The Activity Monitor allows you to view the system disk usage in real time
- Click the Disk Activity tab to view the disk stats

You can use the disk activity tab to monitor the number of reads and writes occurring on all your hard disks. It also shows the amount of data that has been read from and written to your disks. This tab is useful for viewing how much data is currently being, or has already been, swapped in and out of virtual memory.
To calculate overall disk usage after running Iguana for an hour:
- Use Get Info tab to view the space available on a particular hard drive
- Make a note of the Available currently available on the hard drive. Write the value down on a piece of paper, so you don’t forget it (or take a screenshot).

- Run Iguana for an hour, and compare the before and after Available values.
To calculate your disk usage using the results, you would do the following:
162.8 GB - 162.78 GB = Difference of .02 GB = ~20 MB per hour
This means you’re using approximately 20 MB of disk space every hour during the peak periods.
Note: To get a more definitive value, you could determine how many messages were sent in one hour via the Logs tab, and then do the following:
Number of messages sent per hour x ~1 KB per message = Total value in KB / 1000 = Total value in MB
This value will most likely be lower than the 20 MB that was estimated using the Activity Monitor.
Mac OS X: View Network [top]
To view the network usage:
- Click Finder > Applications > Utilities > Activity Monitor. The Activity Monitor allows you to view the system CPU usage in real time
- Click the Network tab to view the network stats

You can use the Network tab to monitor the amount of network traffic that’s occurring on your system. The Network tab also shows the number of packets in and packets out, the rate of packets in seconds, and the amount of data moved in megabytes. It also shows the throughput of data over time using a small graph.