Search/Filter the Logs
Contents
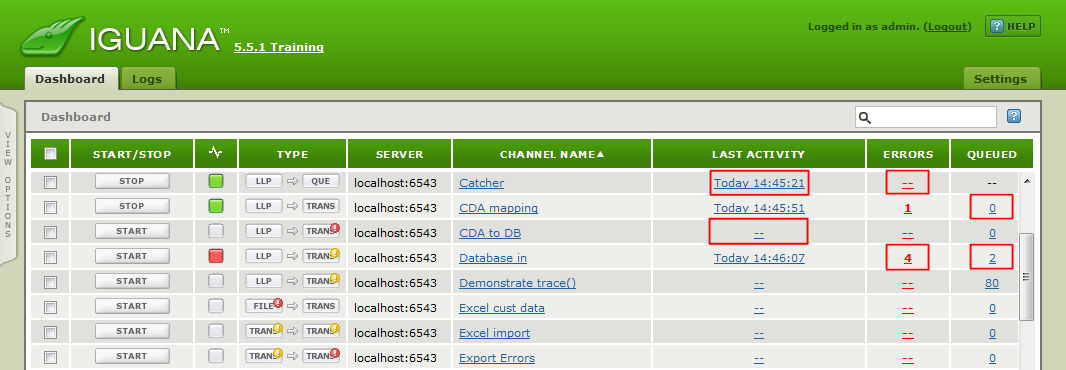
From the dashboard we can get to the Logs tab directly or by clicking on various statistics like the latest activity, errors or queued messages for a channel.
This screen shot of the logs tab shows the major components:
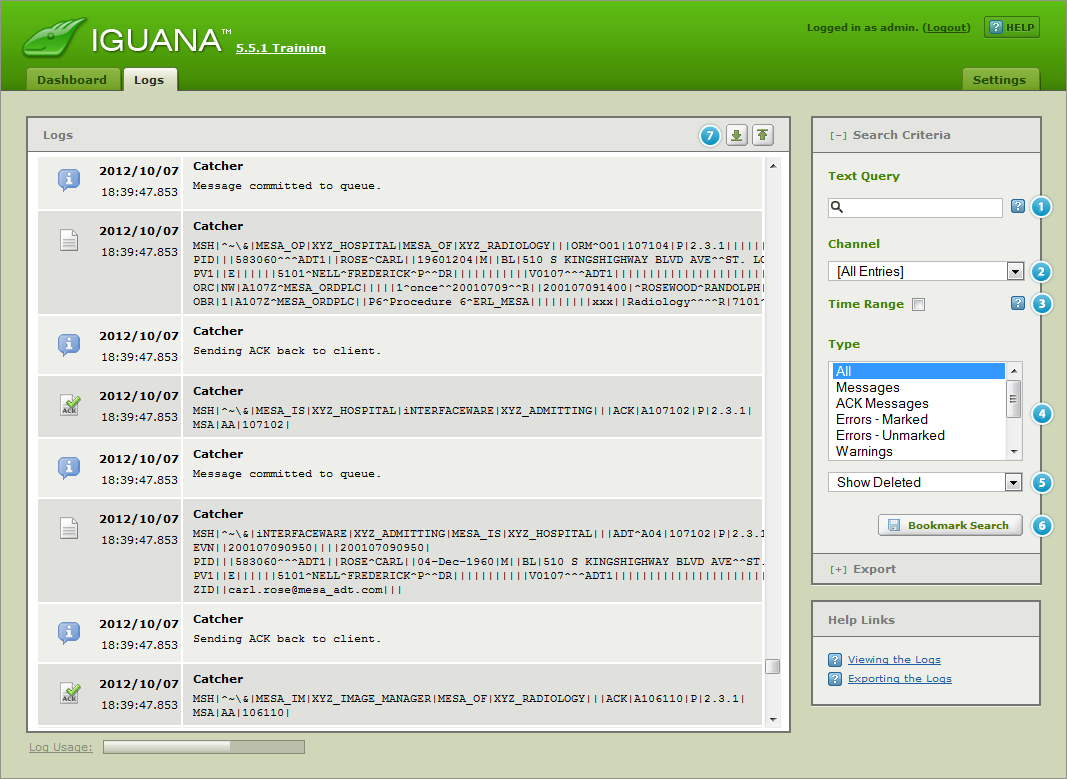
- The text query box is used to filter the logs, it can take a plain string or a complex boolean expression, it also accepts regex patterns. Iguana maintains a full text index for rapid searching. Partial substring searches have to be escaped with a “!” before the string, which will be slightly slower as it does a linear search of the logs.For more information on the search criteria that you can use, see Specifying Search Criteria in a Dashboard Search (which uses the same criteria).
Note: Iguana uses index-based searching. For most searches this search method produces results much more quickly.
Iguana also contains a low-priority thread that checks whether each log file has had an index file defined for it. If an index file is missing, the thread creates it. Log files are searched in reverse chronological order, from newest to oldest.
Searches that use regular expressions or prefixed with “!” are do not use the indexes.
Tip: Using the “!” search prefix.
In some cases, the index-based search may not display matches that are found in the middle of a word. For example, the search criterion “Acct” may not match a message containing the string PatientAcct. If you suspect that this might be happening in your search, try ! as the first character in your search to use slower non-indexed search (for example, use “!Acct” instead of “Acct”).
! only has special significance when it is the first character in a search. If ! appears anywhere else in a search criterion, it is treated as part of the string to be searched for.
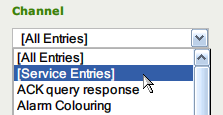
- Use the Channel list box to select the source of the log messages. We can filter results for a specific channel or the Service Entries (administrative log entries from the Iguana Server service/daemon).
- Check Time Range to restrict to a given date or time range. You can enter dates in free format like January 1 2011 or 1-Jan-2011, or use the calendar control.


Note: If you do not specify a start date, Iguana displays all messages that were sent before the to date. Similarly If you do not specify an end date, Iguana displays all messages after the from date.
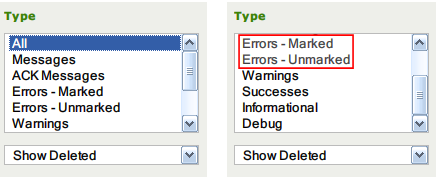
- Use the Type list box to filter on the type of logs. Select All to display all message log types, or you can select one or more log message types to display. See Types of Log Messages, for more information on the various log types.
Note: Log entries cannot be deleted, only hidden.
Errors can be Marked as not needing attention (hidden), you can choose to view Marked or Unmarked errors.
- Use the Show Deleted list box to choose whether to show/hide “deleted messages”.
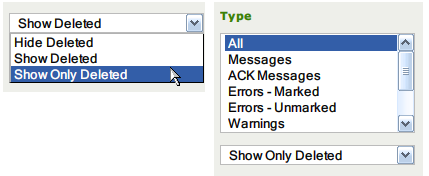
Note: Log entries cannot be deleted, only hidden.
Messages can be flagged as Deleted (hidden), you can choose to show deleted messages.
Deleted messages are displayed using grey overstrike characters, and DELETED is superimposed on the message icon:

As with any other log message, you can click a deleted message to view it:

- We can use the Bookmark Search to create a URL for a search. Using a URL to quickly recreate a search is really handy (particularly with complex searches and regex). Some customers have even set up wikis that allow their team to retrieve common search criteria.

- The Up and Down buttons, or Ctrl+Home and Ctrl+End shortcuts, jump to the to first or last item meeting the current filter criteria.

Tip: When the Export panel is visible the Search Criteria are hidden.
Click the link or the “+” to show the Search Criteria panel:


Pingback: Top Support Questions of March 2015 - iNTERFACEWARE Inc.