Viewing Server Information
Contents
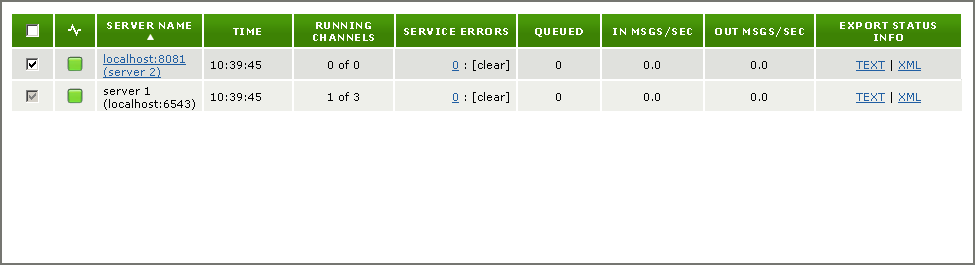
You can use the Dashboard to view information about all of the servers that you have installed. To view the Dashboard, click the Dashboard tab. The Dashboard server list appears as the lower panel. The servers are displayed in a table, one row per server:
The table below lists the columns that are defined for each server. Some of these columns may be hidden. To display a column that is hidden, use the Dashboard View Options tab. See Specify which Dashboard Columns to View.
| Column Name | Description |
|---|---|
 (check box) |
A check box that enables you to select or unselect a server. Unselected servers remain listed in the Dashboard server list, but information on their server status is not displayed. See the picture immediately following this table for an example of an unselected server.Note that you can only unselect remote servers. The server that you are logged into cannot be unselected. |
 |
The current status of the server. This column cannot be hidden. |
| Server Name | The name of the server, if a name has been provided, with the server URL in parentheses. If no server name has been defined, the server URL is used. For all remote servers, the Server Name column provides a link to the server. This column cannot be hidden. |
| Time | The current time on that server. This is useful if a remote server is in a different time zone. |
| Uptime | The elapsed time since the server was last started. |
| Running Channels | The number of channels currently running, and the total number of channels defined. |
| Version | The version number of this Iguana server. For more information, see Displaying the Iguana Version. |
| Service Errors | The number of service errors detected. See Viewing Service Errors for Servers for more details. |
| Queued | The number of messages queued on this server. |
| In Msgs/Sec | The rate at which messages are coming into the server. See Measuring Server Message Traffic for more details. |
| Out Msgs/Sec | The rate at which messages are going out of the server. See Measuring Server Message Traffic for more details. |
| DB Connections | The number of database connections in use by this server. |
| In/Out Ports | The number of ports that Iguana is listening to, and the number of outbound LLP ports. For more information on listening ports, see Viewing the Listening Ports. For more information on outbound LLP ports, see Viewing the Outbound LLP Ports. |
| CPU % | The load on the Central Processing Unit (CPU) for the computer on which the Iguana server is running. This is displayed only for remote servers that are running version 4.5.3 or later of Iguana. |
| Disk Free (MB) | The amount of free disk space on the computer on which the Iguana server is running. This is displayed only for remote servers that are running version 4.5.3 or later of Iguana. |
| Process ID | The process ID for the Iguana server. This is displayed only for remote servers that are running version 4.5.3 or later of Iguana. |
| Memory (KB) | The number of kilobytes of available memory on the machine on which this server is running. On Windows, this measures the page file usage. This is displayed only for remote servers that are running version 4.5.3 or later of Iguana. |
| Resident Memory (KB) | The number of kilobytes of resident memory on the machine on which this server is running. On Windows, this measures the working set size. This is displayed only for remote servers that are running version 4.5.3 or later of Iguana. |
| File Handles | The number of file handles in use on this server. This is displayed only for remote servers that are running version 4.5.3 or later of Iguana. |
| Threads | The number of job threads in use on this server. This is displayed only for remote servers that are running version 4.5.3 or later of Iguana. |
| Response Time (Sec) | The server response time, measured in seconds. |
| Channel Info | Information on channel properties and channel routes. For more details on channel properties, see Channel Properties. For more details on channel routes, see Viewing the Channel Routes. |
| Export Status Info | Links that enable you to view dashboard information for this server. |
If you have used the check box to unselect a server, the unselected server appears on the Dashboard server list as shown below:
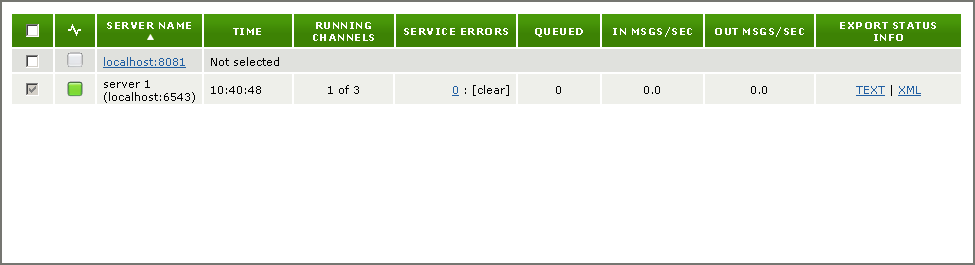
When you select an unselected check box, the server information is displayed in the Dashboard server list.
Continue: Displaying the Iguana Version