Viewing Listening Ports
Contents
You can view a list of the ports that an Iguana server is using. This helps ensure that the channels you have defined do not conflict with one another.
To view a list of the ports in use:
- Click the Dashboard tab. The Dashboard channel list and Dashboard server list appear.
- In the Dashboard server list, click the first of the two In/Out Ports links for the server whose ports you want to list:

Tip: If the In/Out Ports column is hidden, you can use View Options to display it. See Specify which Dashboard Columns to View.

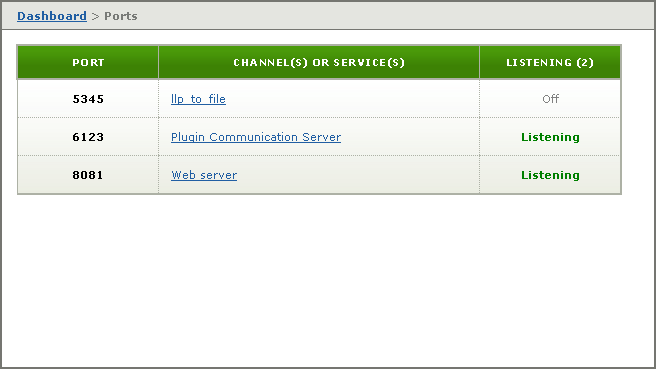
This screen lists the ports in numeric order, from lowest to highest. If a port is currently in use, the Listening column for that port is set to Listening. The Listening column also displays the number of ports that are currently being listened to.
The Channel(s) or Service(s) column provides links to information about the application or channel that is using the port:
- The Web server link points to the Web Server screen.
- The Plugin Communication link points to the plugin configuration screen.
- Each link to a channel points to the Channel Information screen for that channel.
Tip: For information on how to select and manage ports in Iguana, see Port Management Tips.
