Unix: View CPU
Contents
To view the CPU usage in Unix, simply type top from a command prompt. Top provides you with an overall view of CPU usage in real time.
After an hour of running Iguana, the CPU usage stats are as follows:
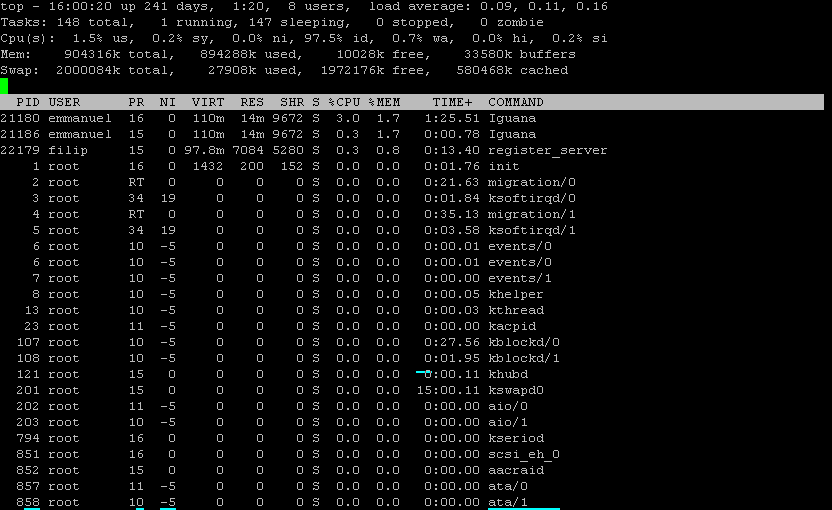
Note: This is an old screenshot the Iguana executable file is now named iguana, not Iguana.
| Top Parameter | Description | Value | Suggested Average Threshold |
|---|---|---|---|
| %CPU | The task’s share of elapsed time since the screen was last updated. This value is expressed as a percentage of total CPU time. | ~2.9% | 10-15%; threshold can increase if Iguana is the only main application running on the machine (not including background processes). For the most part this number should be below 20%, with only the occasional spike. |
To find out which process is using up the most CPU power, type the following command:ps -eo pcpu,pid,user,args | sort -r -k1 | lessThis displays the top 10 users on the Linux system. As you can see, Iguana is the top CPU user at 2.9%: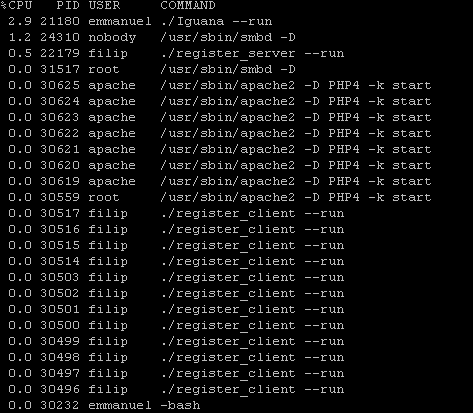 |
To view CPU stats, along with memory, i/o and swap information, simply type vmstat from a command prompt:

| Vmstat Parameter | Description | Value | Suggested Average Threshold |
|---|---|---|---|
| r (runnable threads) | Average number of runnable threads over a specified interval. | 1 | If r (runnable threads) / Number of CPUs = > 1 , there may be a CPU bottleneck. |
| us (user time) | Breakdown of percentage usage of CPU time. If a system has more than one processor, this value is the calculated average. | 3 | If us (user time) + sy (system call) = close to 100, there may be a CPU bottleneck. |
| sy (system call) | Interrupt rate per second. | 0 | If sy (system call) + us (user time) = close to 100, there may be a CPU bottleneck. |
Continue: Unix: View Disk